
A few weeks ago, while reviewing service metrics in Grafana, I noticed some unexpected behaviour in one of our services—there were more pods than necessary given the current traffic load. This led me to uncover that the extra pods were spawned by the Horizontal Pod Autoscaler (HPA) based on the metrics we had configured (a while ago). Understanding HPA took me a few hours. This is a task typically handled by specialized teams in larger companies, but working at a startup forces you to wear many hats and I often find myself analyzing how models perform in production. In this post, I’ll discuss the issues I encountered with HPA and demonstrate how a simple visualization tool can help anticipate the number of replicas needed.
What is HPA?
The Horizontal Pod Autoscaler (HPA) in Kubernetes automatically adjusts the number of pod replicas in a deployment, replicaset, or statefulset based on observed CPU utilization or other select metrics. This feature is very useful for managing application scalability and resource efficiency, particularly in environments with variable workloads.
For example Statsbomb can use HPA to handle increased traffic during a weekend when there are more games being played. The HPA can automatically scale up the number of web server pods to maintain performance, and scale down during off-peak hours to reduce costs. This dynamic adjustment helps ensure that the application consistently meets performance targets without manual intervention.
In next sections I will briefly explain how HPA works and how to use this simple tool to ease your scaling decisions.
How does HPA work?
First of all we need to make sure we understand the concepts of requests and limits since they are fundamental to how resources are allocated and managed across the pods in a cluster.
- Requests: This value specifies the amount of CPU or memory that Kubernetes guarantees to a pod. When a pod is scheduled, the Kubernetes scheduler uses this request value to decide on which node the pod can fit. So this number ensures the pod has the resources it needs to run.
- Limits: This value specifies the maximum amount of CPU or memory that a pod can use. If a pod exceeds this limit, Kubernetes will throttle the pod or kill it. This is how k8s ensures that a single pod does not consume all the resources in a node.
Imagine our deployment has the following setup:
# deployment.yaml
resources:
  limits:
    memory: 2000Mi
    cpu: 1500m
  requests:
    memory: 1350Mi
    cpu: 500m
And our HPA is configured in the following manner:
apiVersion: autoscaling/v2
kind: HorizontalPodAutoscaler
metadata:
  name: autoscaler-name
spec:
  scaleTargetRef:
    apiVersion: apps/v1
    kind: Deployment
    name: autoscaler-name
  minReplicas: 1
  maxReplicas: 3
  metrics:
  - type: Resource
    resource:
      name: cpu
      target:
        type: Utilization
        averageUtilization: 90
  - type: Resource
    resource:
      name: memory
      target:
        type: Utilization
        averageUtilization: 90
So what does this mean? Well if you are a proper engineer what you would do is check the official docs and try to carefully understand this. But if you are like me… you probably would make some assumptions and hope for the best (only to end up having to read the docs 😅).
My first guess was that this would configure HPA to scale up the number of pods when memory or CPU usage exceeded 90%. However, I overlooked a crucial detail: the calculation also needs to include the current number of replicas. Here’s how HPA actually works:
desiredReplicas = ceil[currentReplicas * ( currentMetricValue / desiredMetricValue )]
Where:
currentReplicasis the number of replicas the deployment is currently running.currentMetricValueis the current value of the metric we are monitoring (e.g. CPU usage).desiredMetricValueis the target value for the metric we are monitoring (e.g. 90% requested CPU usage).
So let’s see what I observed in Grafana that day.
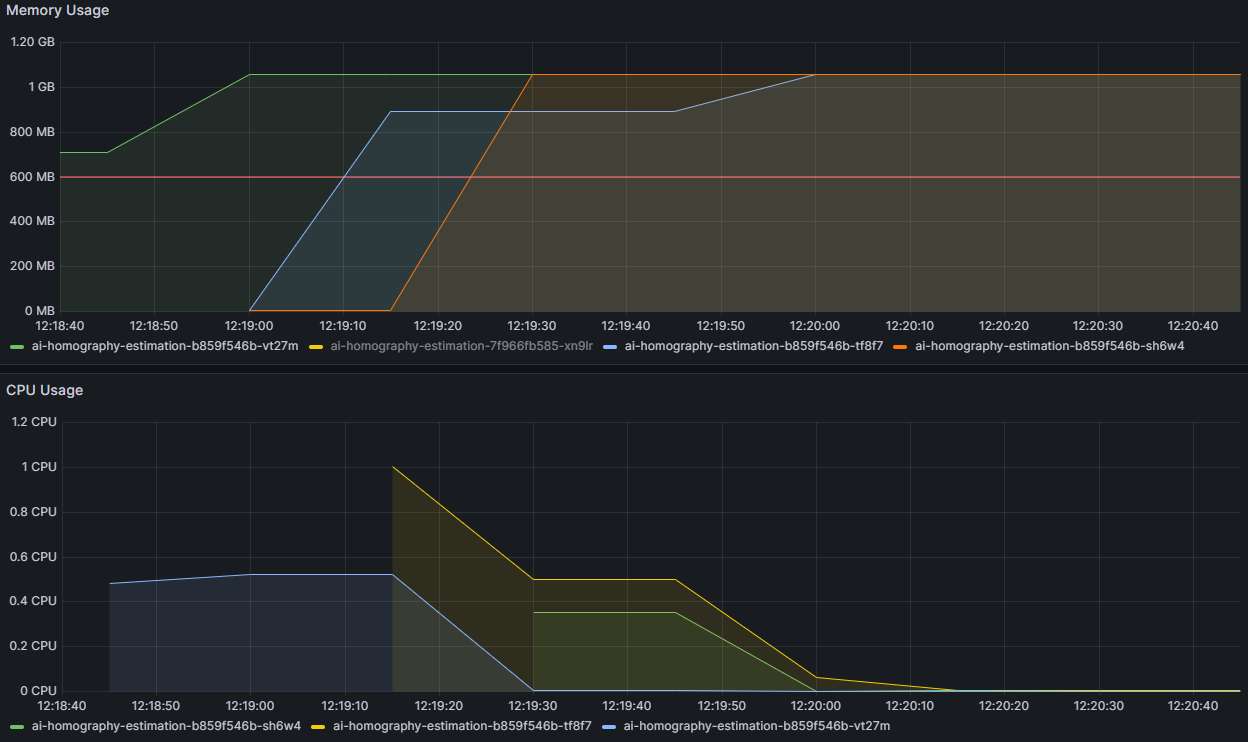
Figure 1. Grafana plot showing memory and CPU usages. Note pod colors differ between CPU and Memory usage
What I observed was that at 12:20, we had three pods running with memory usage around 1100 MB and CPU usage less than 100m. Both metrics appeared to be below the target values: 1215 MB (=0.9*1350 MB) for memory and 450m (=0.9*500m) for CPU. So, why were there three pods running?
Visualization tool
Before moving forward with the debbuging I would like to introduce the visualization tool I have built. It allows you to enter the specific details of your current/target metrics, as well as the current number of replicas. Based on those inputs, it computes and displays the desired number replicas using the scaling formula above.
Debugging HPA
Let’s start by inspecting what has happened to our application step by step using our visualization tool using previous metrics. First, let’s check the memory usage at 12:18:
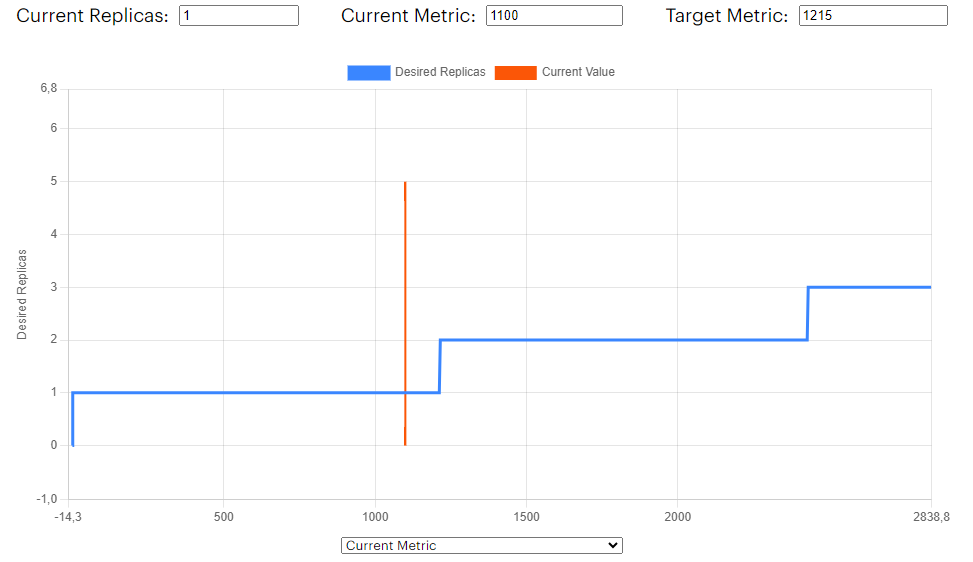
Figure 2. HPA memory expected replica
The memory usage seems to be below the 90% so the number of replicas would be set to 1. Let’s do the same for the CPU usage assuming a value of 600m at that time:
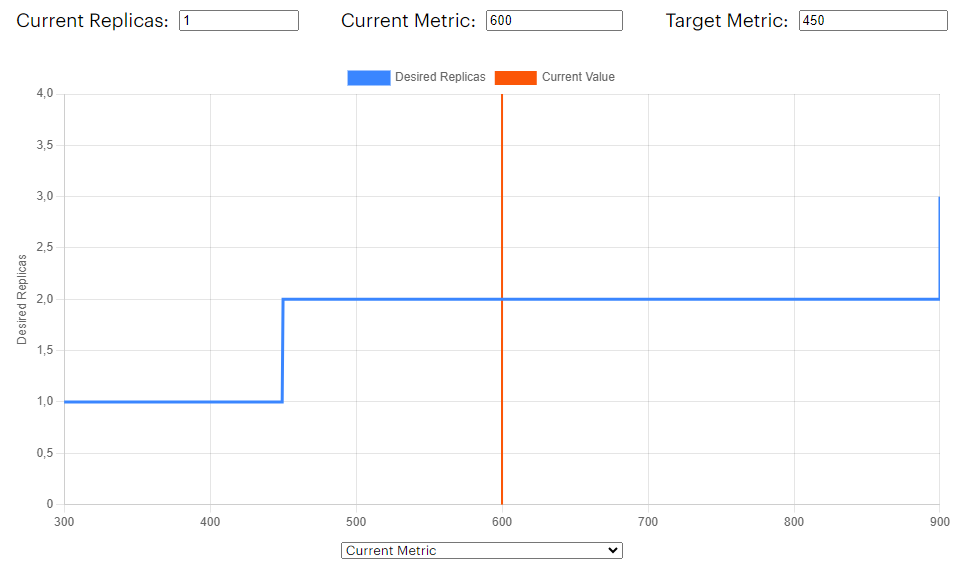
Figure 3. HPA CPU expected replica
At startup, the CPU usage for the pod exceeded the target value of 450m. This means that the currentMetricValue / desiredMetricValue ratio was greater than one, indicating that the autoscaler needed to scale up the replicas. But by how much? Let’s adjust the x-axis of the plot to display the number of replicas:
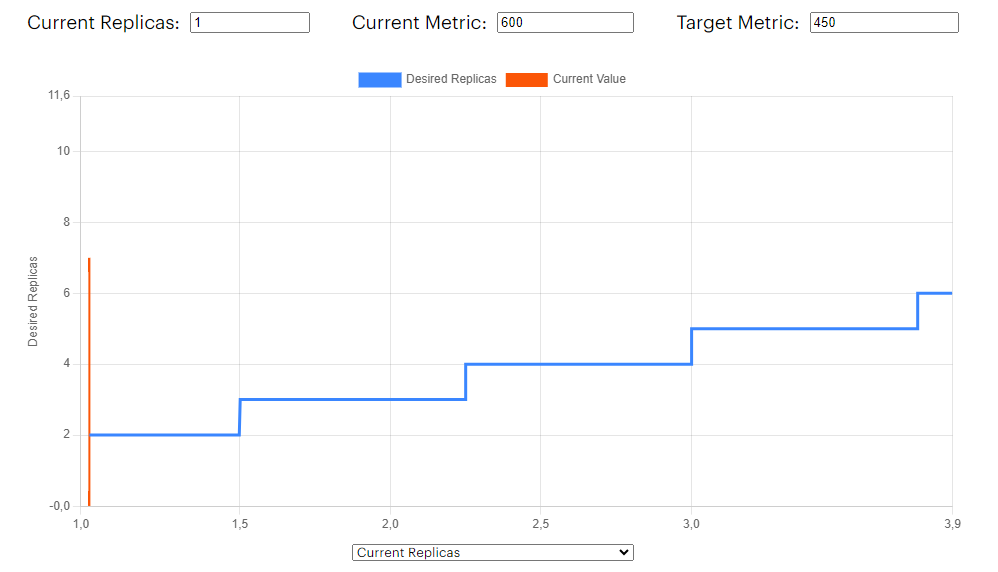
Figure 4. HPA CPU current replicas vs expected replicas
There you go! We can clearly see the staircase pattern, similar to $f(x) = x + 1$. This occurs because the currentMetricValue / desiredMetricValue ratio is greater than 1, prompting the autoscaler to continuously increase the number of replicas until it reaches the maximum allowed. In this instance, maxReplicas was set to 3. Thus, we have identified the root of the problem!
Why is HPA not scaling down?
Although CPU usage spiked at startup, it quickly returned to low levels. So why isn’t the HPA scaling down the number of replicas? It appears that the CPU requirement is well below the target value of 450m, as illustrated in Figure 1. According to the official HPA documentation:
“If multiple metrics are specified in a HorizontalPodAutoscaler, this calculation is done for each metric, and then the largest of the desired replica counts is chosen.”
This indicates that the issue now lies with memory usage. Grafana shows us that memory usage has remained constant after the scaling. According to Figure 2, the expected number of replicas should be just 1. However, since the HPA previously increased our replicas to 3, when we view the same plot with the number of replicas on the x-axis, it reveals the following:
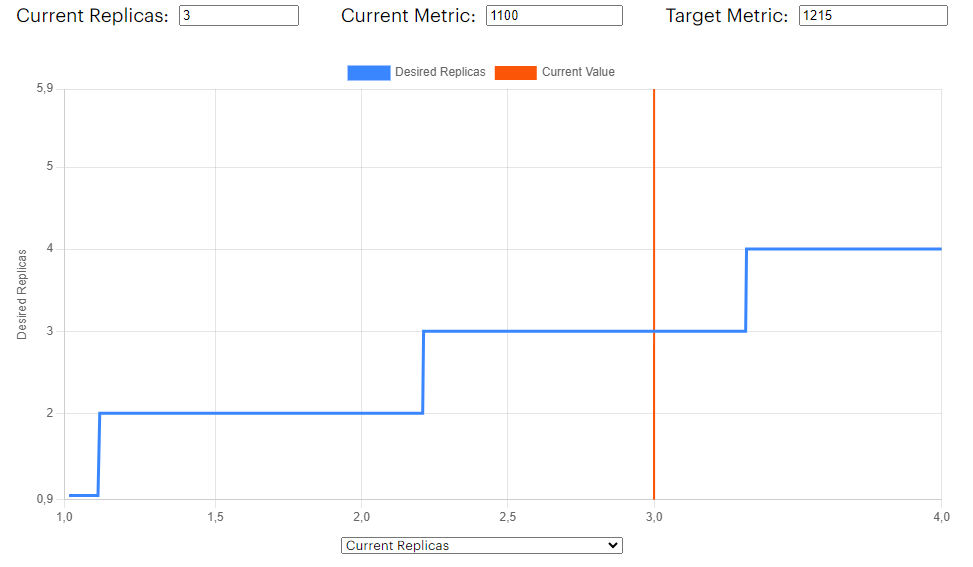
Figure 5. HPA memory current replicas vs expected replicas
With the current memory usage, the HPA behaves like the function $f(x) = x$, preventing the number of replicas from scaling down. This is why we continuously see three pods running, even though the pods are not receiving much traffic.
What can we do?
We have a couple of options to address this problem. For instance, we could change the memory and CPU targets in the HPA settings. Increasing the CPU requirements could help us avoid the initial spike in replicas and prevent the staircase pattern. On the other hand, if we increase the memory requirements, we could avoid the bottleneck and scale down the number of replicas. However, this isn’t a permanent solution because if our application’s memory use fluctuates, we could encounter the same issue again. Instead, we should tackle the root cause and for this we need to differentiate between the fixed and variable usage of our metrics.
The initial spike in CPU usage was due to the startup process, which is a fixed usage. As we could see before, adding more replicas doesn’t alleviate the problem because the usage is related with the startup process and not the traffic. Conversely, when requests arrive at our service, the CPU usage can change, allowing the HPA to scale up or scale down the number of replicas. This represents variable usage.
The memory usage always stays the same, no matter how many pods are running. It is another example of fixed usage. Because of this, the HPA behaves like a function where $f(x) = x$. Therefore, adjusting the number of pods based on memory usage doesn’t work well because the memory doesn’t vary with the traffic. The best strategy is to remove the memory metric from the HPA settings and scale only based on the CPU metric.
Conclusion
In this post, we explored how the Horizontal Pod Autoscaler (HPA) in Kubernetes manages the number of pods based on CPU and memory usage. This is very important for keeping applications running smoothly as demands fluctuate. However, we learned the importance of monitoring HPA settings and adjusting them to fit real-world scenarios.
Through an example, we’ve discovered how various metric patterns can influence the HPA’s behavior and the importance of selecting appropriate metrics. Metrics that do not adjust with traffic levels or pod count may not be appropriate for making scaling decisions.
For anyone using Kubernetes, whether in a small startup or a large company, understanding how to properly manage these settings is essential. It’s all about deeply knowing your systems and making the right adjustments to maintain efficiency and responsiveness.